
This is the second part of the HyperVolatility fundamental focusing on global shipping. The first part of this research is called “Global Shipping and International Trade”.
The world of shipping is as fascinating as sophisticated. Shipping is the most important segment of physical trade because it transports more than 88% of all commodities, raw materials and finished products in the world. The importance of the shipping industry is not just that, though. In fact, ships are often tailored-made to transport specific commodities and the specialisation is often needed in order to maximise yields thanks to economies of scale.
Hence, performing analytics on the shipping world, indirectly, means analysing how the global aggregated demand is evolving over time because ships have to adapt to transporting those commodities or finished products. Consequently, the analysis of the composition and the structure of the global fleet become rather important. The present research, which will go through the composition and structure of the global fleet in 2024, has being built using the latest maritime report issued by the UNCTAD, which belongs to the United Nations and its task is monitoring and analysing Trade and Development worldwide. Hence, all charts and tables that will be commented and analysed belong to UNCTAD.
The years 2023 and 2024 have been rather rough for the shipping world because of geopolitical tensions, disruptions and volatility in the freight rates. Nevertheless, the fleet in 2023 managed to expand by 3.4% annually (it grew by 3.2% back in 2022) but the growth rate was still lower than the long-term average 2005-2023 where the growth rate expanded by 5.2% annually.
Overall, the capacity of the global fleet, measured in dead weight tons, achieved approximately 2.4 billion and the number of ships increased over the course of the last few years because the demand for ships (in particular container ships) have increased also because of the disruptions which forced vessels to sail longer. In general, the global fleet is becoming older and new ships are being ordered to shipyards, nevertheless, the problem that several shipping companies are facing is connected to fuels.
What type of fuel should new ships be using?
This “dilemma” is delaying some orders as some market participants are trying to understand which alternative fuels will become the most easily available in the future. In the meantime, a lot of new ships are being equipped with dual engines which are capable of using two different fuels allowing shipowners to hedge their bets as far as future marine fuels are concerned. Ships are being built with the capability to install an additional engine or to switch to another engine capable of running on a combination of the following fuels: ammonia, methanol, liquefied natural gas (LNG), hydrogen or even batteries-powered engines.
In fact, almost all newly-ordered ships which are capable of using alternative fuels have dual-engines and in almost all cases one of the two fuels is LNG, which appears to be the most commonly chosen environmentally-friendly fuel for the next years to come. In fact, several market participants define LNG as the “transitionary fuel” which will help the shipping world to navigate (pun intended) through the energy transition until potent battery-powered ship engines will be ready to take over.
Fuels might be a headache for the shipping industry but disruptions to maritime chokepoints are serious problems because they force ships to choose alternative routes increasing the costs of everything. Two of the most important chokepoints in the world are the Suez Canal and the Panama Canal and the next chart shows the monthly ship transits from 2019 to 2024:
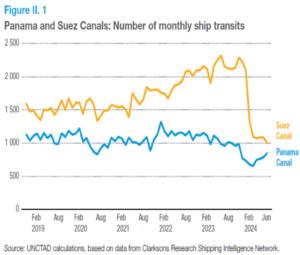
The geopolitical tensions caused by the Houthi attacks which began to be more intense around October-November 2023, forced ships not to sail through the Suez Canal, in fact, the monthly transit of vessels collapsed quite quickly as soon as shipping companies started to react to the attacks by changing their sailing routes. The low water level in the lakes of the Panama canal also caused quite a few delays although around May-June 2024 things started to improve.
Back in 2023, according to UNCTAD, container ships accounted for 43% of all the transits through the Suez Canal, bulker ship transits made up another 19% while the third most common ship category through the Suez Canal were crude oil tankers, petroleum product tankers and petrochemical tankers. In June 2024, because of the Houthi, the ship tonnage which arrived to the Gulf of Aden (at the beginning of the Red Sea) had dropped by 76% while the overall number of ship transits at the Suez Canal had collapsed by 70%. According to UNCTAD and official figures, the ship arrivals to the Cape of Good Hope went up by 89% while at the Suez Canal the ship arrivals of:
I. Gas tankers had dropped by 100%
II. Car carriers (RO/RO ships) went down by 96%
III. Container ships collapsed by 92%
IV. Bulk ship arrivals fell to 64%
V. Petroleum product tanker arrivals plummeted to 60%
VI. Crude oil tanker arrivals was as low as 50%
The disruptions and the changing market conditions over the course of the years caused the global fleet to change too. Hence, the composition of the global fleet evolved to reflect the need of international trade and ageing ships. The following table displays how the different categories of ships in the fleet shrank or expanded between 2023 and 2024:
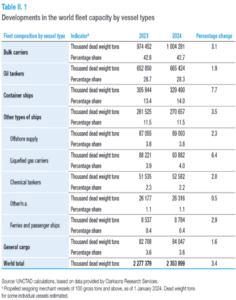
The most significant changes happened in 2 ship categories: the fleet of container ships which went up by 7.7% and the fleet of LNG tankers which expanded by 6.4%. The 3rd category of ships in terms of change is that of bulk carriers which grew by 3.1% while petrochemical tankers and crude oil tankers expanded only by 2% and 1.9% respectively. The growth in container ships expanded because of longer sailing routes, bigger trade volumes and more intense import/export flows (particularly between ships from Asia to the USA and those from Asia to Europe) while the significant expansion in LNG tankers is due to a very important shift within the energy sector. Specifically, the demand for natural gas and consequently LNG is expected to grow massively over the next decades and some official forecasts project its demand to grow by 50% in the coming 35 years. The countries within the European Union, along to other countries around the world, intend to use natural gas and LNG as their primary energy source in the future in order to navigate through the energy transition. Natural gas, in fact, is predominantly made of methane which only has 1 carbon atom and 4 atoms of hydrogen so it has much less carbon atoms than diesel which, for reference, has between 8 and 20 carbon atoms so it is more polluting.
In 2023 and 2024, the global fleet expanded more than trade volume but this did not cause a drop in freight rates because the extra capacity has been absorbed by a higher demand and longer routes. In particular, in 2024 the global fleet was as big as 109,000 vessels (cargo + non-cargo ships) while the average weight of each ship was at least of 100 gross tons.
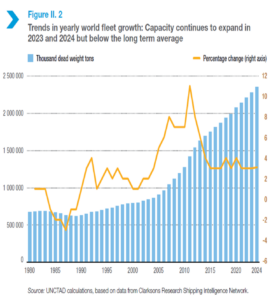
The chart shows that the world fleet remained fairly constant around 1.2-1.3 billion dead weight tons. The aggressive expansion in the global fleet during the period between 2007 and 2012 was due to the Great Depression, which pushed shipyard costs significantly lower making the building of ships rather cheap.
The world fleet might have remained constant in terms of dead weight tons, nevertheless, things have remarkably changed as far as its structure is concerned. The composition of the global fleet, in fact, had to adapt to ever-changing market conditions and certain types of ships have been built more than others (as it was observed in the previous analysis). Nevertheless, the next chart provides a deeper view of how the fleet composition changed from 1980 all the way to 2024 displaying how each vessel sub-fleet shrank or expanded over the course of 44 years:
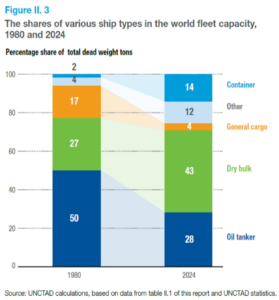
The categories that will be analysed are 4: oil tankers, dry bulk ships, container ships, general cargo ships and others.
Oil Tankers: crude oil tankers consisted of half of the global fleet, in dead weight tons, back in 1980. However, they were less than a third (28%) of the total fleet in 2024. This was clearly due to the energy transition which is forcing several ship owners to keep old tankers for longer period because the uncertainty connected to the future demand of crude oil and petroleum products in 25-30 years (average life for a crude tanker) is also pushing some investors away while some banks might require additional collateral for the syndicated loans they usually provide to shipping companies.
Dry Bulk Ships: the fleet of dry bulk ships expanded significantly since 1980, where these ships were only 27% of the total dead weight tons, to 2024 where they were 43% of the global fleet. The impressive growth of dry bulk vessels is the consequence of the expansion in international trade with some routes (Asia–Europe and Asia–North America) which contributed to increase the global trade of commodities shipped by these vessels (grains, seeds, coffee, cocoa, sugar, iron ore, bauxite, nickel, copper, aluminium, etc)
Container Ships: container ships went from just 2% of the global fleet in 1980 to 14% in 2024 thanks to the fact that containers became the standard way of transporting products on ships. The introduction of containers, around the end of 1950s, has completely changed the way numerous finished products got shipped at sea around the world. It might sound strange but the truth is that containers have been invented only in 1937 by an entrepreneur called Malcom McLean. However, the first container ship began sailing only in 1956 and since then another 35 years have been necessary for container ships to became a consolidated reality within the maritime industry. Another reason for the great popularity of container ships is the international trade from and to Asia: trade volume became bigger and the quantity of finished products imported/exported between Europe and Asia or North America and Asia noticeably increased.
General Cargo Ships: the fleet of general cargo ships plummeted from 17% to 4% but the drop can be attributed predominantly to the introduction of containers. Containers are safer, more efficient and more easily handled. Hence, if cargo can be “containerised”, there will always be an incentive to do it. General cargo ships are there for the rest. These ships usually transport any type of cargo which is difficult to fit into a container which usually means voluminous finished products or finished products with a particular type of shape which would be difficult to fit into a container.
The ”Other” category: this category of ships is very similar to general cargo ships and grew from 4% to 12% because these vessels are usually adopted for voluminous cargo, sail on short distances and serve small ports. The “other” category gathers all those vessels that do not fit into the previously discussed ship categories so it will normally embrace all those vessels which normally transport things that don’t fit into containers and are transported on short distances or can only be transported on small vessels because they have to sail to small ports with a limited draught. These category managed to grow because it is a niche group of ships serving ports whose draught wouldn’t allow ocean-going vessels to enter and because it also involves very specialized vessels like research vessels or RO/RO vessels (roll on/roll off ships) which are often involved in the transportation of cars.
The categories of ships that has been examined so far show how diverse and sophisticated the world of shipping is but they also indicate that there is a need for shipyards to build ad-hoc ships which are capable of handling crude oil, diesel fuel, wheat, iron ore, copper, cars, industrial machinery, etc. Shipyards need time before delivering a fully-functioning vessel, in fact, it normally would take them a few years to deliver an order.
Specifically, a crude oil or petroleum product tanker would be delivered after 2.8/3 years, a capsize dry bulk ship would take 3.4/3.6 years to get delivered, a container ship would be delivered after 3.2/3.4 years while shipyards would need between 4.2 and 4.7 years to deliver an LNG tanker ship. Hence, shipping companies have to move in advance if they do not want to run out of ships and have to order newly built vessels a few years in advance before sending their old ones to scrap. Given the large waiting time and financial commitment to build such engineering marvel, the vessel order book becomes very interesting to analyse. The next chart shows a very interesting table taken from the UNCTAD report displaying the deliveries in 2023. Another reason the vessel order book is so important to study is because these vessels will be sailing for the coming 25-30 years.
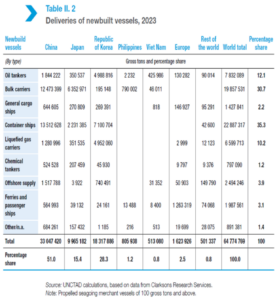
The first thing to notice, before entering into the analysis of what ship type has been delivered in 2023, is that 51% of all ships have been built in China, 28.3% in South Korea and 15.4% in Japan. These three countries are responsible for the 94.7% of the global production of commercial vessels. As far as ship types are concerned, the fleet of container ships is the dominant one because these vessels constitute the 35.3% of all new ships delivered in 2023. The second most delivered type of vessels consists of bulk carriers (30.7% of 2023 deliveries) while at the third place there are two energy-related categories of ships: oil tankers (12.1% of 2023 total deliveries) and LNG tankers (which accounts for 10.2% of 2023 total deliveries).
Overall, the global orderbook in 2023 increased by 9.8% as far as the number of vessels are concerned while it expanded by 9.1% when looking at capacity. However, this growth is lower than that registered back in 2022 and the UNCTAD report suggests that the limited berths’ capacity in shipyards along to high building costs for new-builds are the two predominant reasons which caused fleet growth in 2023 to be more moderate than in 2022.
In terms of age, the global fleet is, on average, quite old. In fact, a large amount of vessels is actually older than 20 years with general cargo ships being the oldest fleet.
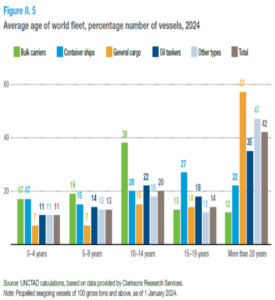
Bulk Carriers: the vast majority of bulk ships are in the 10-14 years category with younger ships between 0 and 9 years being more numerous than older ones between 15 and 20 years of age.
Container Ships: the largest part of vessels in this category is in the 15-19 years group or in the “more than 20 years” old category, although the percentage of container ships in the 10-14 years group is also fairly good. The container ship fleet is well distributed across all “age groups”.
General Cargo: this type of ships are rather old, in fact, the vast majority of the vessels are grouped in the “more than 20 years” group. General cargo ships are being almost completely replaced by container ships which are more efficient so there is not much incentive to have a large global fleet of these vessels. This is the reason why general cargo is the lowest type of ship in both the “0-4 years” and “5-9 years” groups.
Oil Tankers: a good amount of vessels are older than 20 years, however, oil tankers tend to be well distributed across the ship age spectrum. In fact, there are quite a few vessels in almost all age group, even though the “0-4” year category has the least amount of oil tankers because investors and shipping companies are trying to diversify their fleet in order to gradually accommodate the need of the energy transition.
Other Types: this category takes into account all specific types of vessels (like RO/RO ships) which do not fit in the previous category along to a lot of ships that are built for general types of transportation on short distances. These vessels are quite old, in fact, the majority of them are in the “more than 20 year” old group, however, there is a decent amount of younger ships that are still being built because short-distance sailing might requires ad-hoc vessels which are capable of sailing into shallow-water ports.
All ships at some point will have to be retired and scrapped. However, some vessels get scrapped after 25-30 years while some others will get scrapped after 18 years; it largely depends on market conditions and the fluctuation of freight rates. The next chart shows how scrapping activities developed throughout the year 2023:
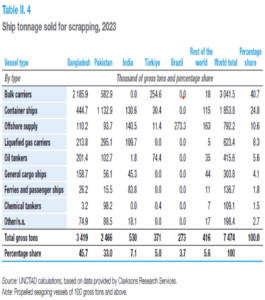
The first thing to notice is that the biggest scrapping countries in the world are Bangladesh and Pakistan, in fact, these two countries are responsible for 78.7% of all vessel-scrapping around the world. Another thing to notice is that not all countries involved into scrapping are capable of processing all vessel types. For instance, India does not scrap chemical tankers while Türkiye and Brazil did not scrap any LNG tanker in 2023. It goes without saying that there are also preferences so some scrapping shipyard might prefer processing bulk carriers rather than petrochemical tankers.
However, the most complex types of ships (LNG tankers, petrochemical tankers, oil tankers, etc) must be scrapped following specific procedure to guarantee the safety of the personnel so not all shipyards can process them. For example, LNG is highly toxic for humans but also for the surrounding environment (ships normally get scrapped on a beach) because some residual oils or left-over chemicals, in oil and chemical tankers for example, can be highly polluting for the water and the beaches in which the scrapping takes place.
Nevertheless, scrapping does not necessarily happen just because a vessel has become old, another reason which often leads shipowners to decide to scrap a ship is low freight rates. The next chart helps to understand the shipping cycles that help investors, shipowners and shipping companies to decide if a ship is worth demolishing or not:
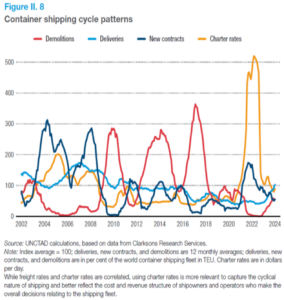
The fluctuations of freight rates make ships more or less attractive and this impacts the demolition rate. In this case, the demolition rate and recycling was low in 2023 and in the first half of 2024 because the high freight rates did not incentivise shipowners to demolish ships. Delaying fleet renewal is a strategy often played by shipowners which tend to hold on to older tonnage when freight rates are very high or when disruptions or geopolitical tensions increase the need for vessels.
The third part of this HyperVolatility fundamental research is called “Global Maritime Powers: Who Rules the Waves?”