
This is the last part of a large study entirely conducted on the shipping industry.
This research went through the maritime UNCTAD report and commented all sections of such study in order to provide a thorough analytics of the world fleet, its composition and the seaborne trade. Please note that all tables and charts presented in this large study have been produced by the UNCTAD team.
The 3rd part of this large study is called “Global Maritime Powers: Who Rules the Waves?” (a list of all the remaining studies which execute this research can be found at the end of the present one).
Freight rates are the lifeblood of the maritime industry. Freight rates are the predominant source of money for shipping companies and shipowners. It does not matter if freight rates are negotiated on a registered exchange, like the Baltic Exchange, or they are agreed via a broker (so-called shipping fixtures) in the Over-The-Counter market.
Freight rates are financial prices which are negotiated among shipowners and cargo-owners and they are usually priced in $/day or $/metric ton. The fluctuations of freight rates and their cyclicality are crucially important for shipping companies but also for hedge funds that invest into the shipping sectors because freight rates determine the size of the yields from the investment.
The fluctuations of freight rates depend on demand and supply dynamics, however, just like in energy markets, they are heavily impacted by geopolitical risk. In fact, around the end of 2023 the Houthi attacks to several container ships and crude oil tankers around the maritime passage of Bab-el-Mandeb substantially incremented the volatility in both energy markets (crude grades, petroleum products and LNG) as well as in shipping freight rates.
Several shipping sectors have been deeply impacted by the volatility, in fact, both the container and dry bulk segments began reporting significantly higher volatility with freight rates dropping in 2023 because of problems with ship supply while in 2024 a lot of instability was mainly caused by the Houthi attacks.
In 2024, in particular, freight rates for crude oil tankers and product tankers (vessels transporting diesel, gasoline, fuel oil, etc) remained rather sustained as a consequence of the geopolitical instability and also fairly volatile (once again attacks to vessels in the Suez Canal had a large impact on price volatility). The volatility in freight rates, particularly if it becomes persistent, leads to an increment in regional inflation because it has a domino-effect on the price of several commodities transported via ships (like sugar, coffee, cocoa but also fruit, fresh produce, etc).
The negative impact of freight rates can actually be limited but that requires constant monitoring, in-depth market intelligence and an efficient strategy. The following analytics, which will be entirely based on the latest maritime UNCTAD report, will go through the container, dry bulk and tanker segments of the shipping market and analyse their developments through the 2023 up to mid-2024.
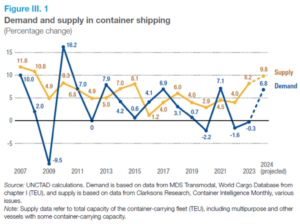
The container market rebounded in 2023 and provided encouraging signals also in the first months of 2024 which is expected to end on a positive note with a significant growth as far as both demand and supply are concerned. The demand evidently dropped back in 2020 because of the COVID pandemic, it quickly bounced back up in 2021, however, the geopolitical tensions pushed it lower once again in 2022 but since late 2023 – early 2024 it is expected to be recovering.
The container shipping segment is complex and it involves a great deal of coordination and logistics, nevertheless, one of the most important characteristics of this trade is its geography: the Asian continent, given its propensity to export, is the most important global centre for container shipping. The shipping routes between Asian countries (China above all) and Europe or Asian countries and the USA are the busiest of all. This is why it is so important to analyse the Shanghai Containerized Freight index post rates:
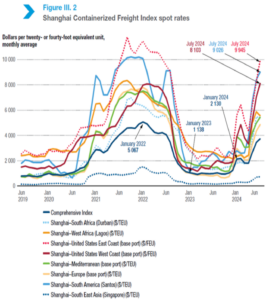
The initial predominant pattern indicates an increment in freight rates starting in January 2021. The global economy began “moving” again after the COVID pandemic and the demand for goods and energy (from crude oil to petroleum products, from LNG to LPGs) started to increase once again pushing higher freight rates for routes from Shanghai towards Africa, USA, Northern Europe and the Mediterranean.
Specifically, the routes from Shanghai to the US East Coast and South America experienced the highest increment in freight rates followed by those leading to West Africa, US West Coast, Europe and the Mediterranean. The COVID crises caused some shipping companies to re-dimension their fleet as a result of a lower trade demand which, in turn, forced some of them to sell their vessels in order to remain in business.
This and the re-opening of the global economy after the pandemic boosted the aggregated demand and, consequently, the demand for vessels which, in turn, pushed freight rates higher ($7,500- $10,000 monthly average). As things began to normalise, freight rates moved lower around the $2,000 level and fluctuated sideways until the last quarter of 2023 which is when geopolitical tensions in the Middle East and the first attacks to vessels sailing through the Strait of Bab-el-Mandeb began to agitate the water.
The Houthi attacks became more frequent forcing several shipping companies to find alternative routes but for those coming to the Mediterranean or Northern Europe the only feasible route was through the Cape of Good Hope. This implies that ships had to circumvent the whole African continent to get into the Mediterranean Sea via the Gibraltar Strait or to get to ports in Northern Europe.
Needless to say that this pushed freight rates higher causing a high deal of volatility among regional freight rate indices and the Shanghai Containerised Freight Index is no exception to this rule. The longer journey meant also that numerous ports were jammed with containers causing longer overlay periods which, in turn, reduced the availability of several vessels. This had the domino-effect of exacerbating even more the upside volatility and the aggressive ramping up in freight rates. The same behaviour can be easily spotted in the ConTex Index which tracks the performance and fluctuations of freight rates of chartered container ships:
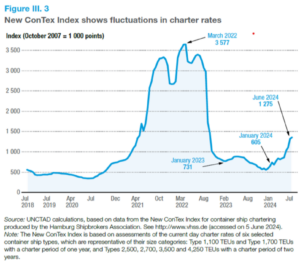
Chartered ships are vessels operated under the charterer formula: the shipowner places an order to the shipyard and buys the vessel. Once the vessel is delivered, the owner charters it away (it rents it) and it is no longer responsible for the operating costs like fuels or maintenance. Once the ship is chartered, the shipowner (or the company which owns the ship) earns the freight rate which is paid by the charterer who is responsible for all maintenance and operating costs of the vessel. A ship can be chartered for a single journey (voyage charter) or for an agreed period of time (hire charter).
The UNCTAD report clearly shows an aggressive bullish trend starting in 2021 which became even bigger in 2022 because of the Ukraine war and normalised in 2023. Charter rates (cost of hiring a container ship) began moving higher again in 2024, which is the exact same patterns followed by the Shanghai Containerised Freight Index. Charter rates went up across almost all vessel sizes.
In fact, charter rates for small vessels increased because of the general impact that the Houthi attacks had on the shipping industry while the demand for larger vessels expanded because they are ideal for rerouting. Large vessels are better equipped for longer voyages and maintain the cost-effectiveness generated from economies of scale so when it comes to rerouting (like in the case of the Red Sea) their demand goes up because they are more cost efficient.
Part of the reason why charter rates plummeted around January 2023 is because shipping capacity, as far as container ships are concerned, had outpaced demand in TEUs (which stands for Twenty Equivalent Unit. These are 20-foot or 40-foot containers) and the large availability of vessels pushed charter rates lower. Conversely, in 2024, the major disruptions caused by the Houthi attacks and the consequent cargo rerouting along to the drought in the Panama Canal absorbed the capacity oversupply favouring an increment in charter rates whose uptrend was also backed by other geopolitical tensions (e.g. Ukraine war).
Another segment of the shipping industry which is worth studying because of its significant importance is bulk carriers and the Baltic Dry Index is probably the most popular tracking tool for the performance of bulk freight rates:
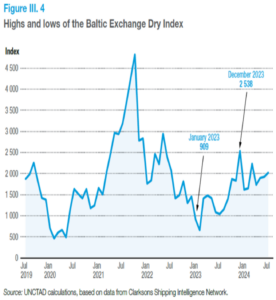
The dry bulk freight market tracks the costs of shipping particular commodities such as iron ore, copper, steel, grains or coal. The freight rate in the bulk industry moved significantly higher in 2021 as a consequence of the demand boom following the COVID pandemic touching the 4,500 points.
However, as market conditions normalised and demand slowly got back to pre-pandemic levels, bulk freight rates began moving lower and an increase in shipping capacity in 2023 pushed the index below the 1,000 points, despite the second peak in early 2022 due to the Ukraine war. Nevertheless, the Red Sea crises, the rerouting of several ships and the increment in costs associated with it caused the Baltic Dry index to move up starting in July 2023 and since then it never moved back down.
The last shipping segment left to analyse is connected to the energy market and tanker ships. In particular, there are 2 indices which are particularly popular and track the performances of 2 sub-segments of tanker shipping: the Baltic Dirty Tanker Index and the Baltic Clean Tanker Index.
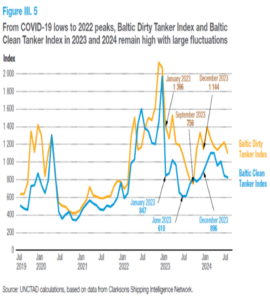
The two previously mentioned indices track complementary, however different segments of the energy sector. Specifically, the Baltic Dirty Tanker Index (BDTI) tracks the freight rates of crude oil tankers and heavy fuel oils (bunker fuel oil, residual fuel oil, etc) while the Baltic Clean Tanker Index (BCTI) tracks the freight rates of petroleum product tankers transporting refined products (diesel, gasoline, jet fuel, marine gasoil, etc).
The fluctuations of the index suggests that back in 2019 and 2020 both dirty and clean tanker vessels experienced high freight rates which, however, peaked in January 2020 and subsequently collapsed because of the COVID pandemic. The demand for crude and petroleum product tankers boomed since January – February 2022 because of two reasons: almost all economies went back to normal after the COVID pandemic and the war in Ukraine which caused quite a few disruptions to the flow of commercial vessels.
As the market “absorbed” the news of the Ukraine war, freight rates for crude and product tankers softened but the downtrend lasted until the last months of 2023 when the Houthi attacks and the geopolitical tensions in the Red Sea caused several tanker ships to avoid that area and reach Europe through the Cape of Good Hope triggering a new uptrend in freight rates which began softening around June – July 2024.
As previously mentioned, freight rates are the predominant source of money within the shipping sector and the next chart displays fairly well how the earnings for crude oil tankers and petroleum product tankers oscillated since July 2019 so far:
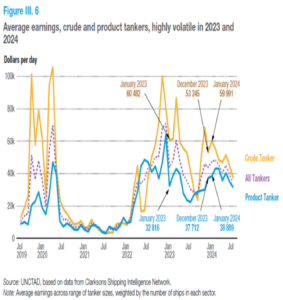
Both crude and product tanker ships’ earnings moved higher and lower based on the volatility of the freight rates tracked by the Baltic Dirty Tanker Index and the Baltic Clean Tanker Index. Tankers’ earnings were high in 2019 and in the first months of 2020 but subsequently the impact of the COVID pandemic began shrinking yields and earnings dropped from 80k-100k for crude tankers in 2019 to 8k-10k in the period ranging between July 2020 to January 2022.
Since the second quarter in 2022, as the global economy began opening back up again, tankers’ earnings moved higher because the freight rates for crude oil and petroleum product tankers jumped from 600 points at the beginning of 2022 (BDTI and BCTI indices) all the way to 1,800-2,000 points in January – February 2023. As post-COVID demand normalised and the oversupply of crude tankers was no longer capable of fully absorbing it, the freight rates and tankers’ earnings softened.
Nevertheless, as the geopolitical tensions and the Red Sea crises began “biting” the market, freight rates jumped aggressively higher with earnings going from 23k–25k all the way to 70k for crude oil tankers (product tankers’ earnings were in uptrend too but their increment was less pronounced than for crude oil tankers).
Around mid-2024, as the market got to terms with the geopolitical tensions, the earnings began to soften once again. This proves the strong connection and inseparable link between freight rates and earnings in a specific shipping segment.
The volatility in freight rates (container vessels / bulk carriers / crude tankers / petroleum product tankers, etc) has a strong impact on earnings. Hence, freight rate cycles, hedging with freight derivatives and a deep knowledge of the shipping industry are crucially important to navigate (pun intended) the fluctuations of the shipping market.
This was the last part of the entire HyperVolatility study conducted on the most recent maritime UNCTAD report. The first 3 researches are the following:
I. Global Shipping and International Trade