
This is the third part of a large HyperVolatility study focusing on global shipping. The first part is called “Global Shipping and International Trade” while the second one is called “World Shipping Fleet: Structure and Composition”
Shipping transports approximately 88% of all commodities, raw materials and finished products in the whole world so it is the most crucial transportation sector there is. Fluctuations in shipping freight rates tend to have repercussions on commodities prices and disruptions to ports and vessels create dangerous domino effects which leads to severe backlogs and increased costs. Shipping, however, despite its strategic importance for commodity finance and international trade is not particularly mentioned in the press and the role it plays in commodity markets is rarely mentioned.
The present research will use the latest UNCTAD report from the United Nations in order to analyse who are the countries that are the real maritime super powers. It is important to point out that all tables and charts which will be analysed and commented in the present analysis belong to UNCTAD.
The first thing that will be analysed are the flag states. The ranking, provided by the UNCTAD report, shows which ones are the most popular flag states chosen by the shipping companies and shipowners. Before diving deeper into the analytics, it is actually necessary to point out that ships can switch flags very quickly and fairly easily. In fact, several countries require little information to register vessels and the administrative procedure are minimal, allowing shipping companies and shipowners to register a vessel in just 24 hours.
Furthermore, several small countries tend to significantly relax their administrative processes to register new vessels while lowering the tax in order to attract as many ships as possible, hence, the regulation is also a key factor in choosing a flag. The maritime industry is very flexible when it comes to choosing a flag so it is very easy to have a diverse fleet where a single shipowner will own an entire fleet with ships belonging to 2, 3 or even 5 different flags (there will be another HyperVolatility research specifically dedicated to flag states). At the beginning of 2024, the ranking was the following:
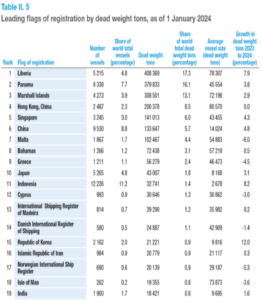
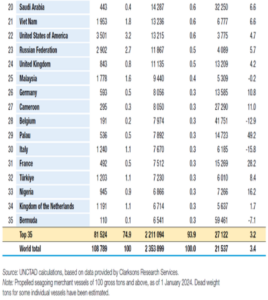
First of all, it is important to note that in 2023, almost 94% of the global fleet belonged to the top 35 flags while the top 10 flags accounted for over 78% of the world capacity. In terms of share of the world’s total deadweight tons (in %) the top 10 biggest flags are the following:
I. Liberia: 17.3% of world’s total deadweight tons (fleet: 5,215 vessels)
II. Panama: 16.1% of world’s total deadweight tons (fleet: 8,338 vessels)
III. Marshall Islands: 13.1% of world’s total deadweight tons (fleet: 42,73 vessels)
IV. Hong Kong: 8.5% of world’s total deadweight tons (fleet: 2,487 vessels)
V. Singapore: 6% of world’s total deadweight tons (fleet: 3,245 vessels)
VI. China: 5.7% of world’s total deadweight tons (fleet: 9,530 vessels)
VII. Malta: 4.4% of world’s total deadweight tons (fleet: 1,867 vessels)
VIII. Bahamas: 3.1% of world’s total deadweight tons (fleet: 1,266 vessels)
IX. Greece: 2.4% of world’s total deadweight tons (fleet: 1,211 vessels)
X. Japan: 1.8% of world’s total deadweight tons (fleet: 5,265 vessels)
Things are about to get more complicated because the owners of these ships are not necessarily from the country under which that vessel is registered. As previously mentioned, shipping companies and shipowners can very easily change the flag of their own ships and they can also be located in different places. For example, the real owner of the vessel is Greek and owns a company which is based in Malta.
This company purchases and owns the vessel on the behalf of the Greek entrepreneur, however, this vessel is being operated by another company located in London while flying a Liberian flag. This example provides an idea of how intricate things can get within the maritime industry and therefore a ship flying the Panama flag does not imply that the owner of the vessel is from Panama. This great level of sophistication requires a more in-depth analysis and the next UNCTAD table presents exactly that:
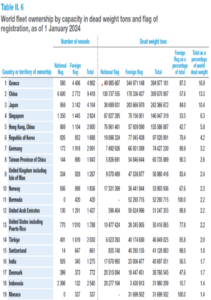
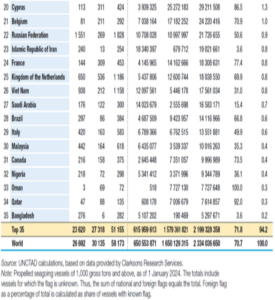
As of January 2024, in terms of capacity measured in dead weight tons, Greece is the country which owns the vast majority of vessels, in dead weight tons terms, in the world. Approximately, 16.9% of the world’s total fleet is owned by the Greeks, 13.3% by the Chinese, 10.4% by the Japanese, 6.3% from the Singaporeans and 5.8% from people in Hong Kong. The Greeks, the Chinese and the Japanese alone control 40.6% of the world’ total fleet while the top 5 control 52.7% of the total fleet in terms of global dead weight tons. If the analysis is extended to the top 10, which owns 67.4% of world’s dead weight, it is evident that shipping is an industry predominantly controlled by Europeans and Asians.
Generally speaking, in 2023, roughly more than half of world ship capacity is in the hands of (it is owned by) owners located in developed economies while 76% of the total capacity is registered under flags of developing economies. The next UNCTAD table ranks the worth of the commercial fleet as a percentage share of the total value of the global fleet:
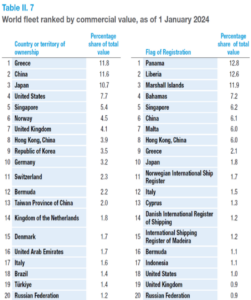
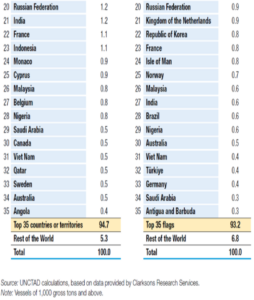
Once again, the most valuable fleet in the world is the Greek fleet, whose value is 11.8% of the total. Greece is one of the top countries in the whole world as far as flag registrations are concerned and the top country, globally, when it comes to fleet ownership and fleet commercial value.
In other words, Greece is the true global maritime power.
After Greece, we have China whose fleet consists of the 11.6% of the total value while Japan’s fleet worth is 10.7% of the global fleet value. China and Japan follows Greece and respectively take the 2nd and 3rd place as global maritime powers because they have several vessels registered under their respective flags but they also own a large amount of dead weight tons whose value is among the top in the world.
The value of Greece’s, China’s and Japan’s fleets together accounts for the 34.1% of the total value of the global fleet. USA, Singapore, Norway, UK, Hong Kong, South Korea and Germany are the remaining countries in the top 10 most valuable fleets in the world ranking and the aggregated value of their fleets accounts for 66.4% of the total value.
Overall, the global fleet in 2024 was worth $1.37 trillion and the biggest owners are from Greece, China and Japan while the vast majority of the most valuable part of their fleets is flying the Panama flag (12.8%), the Liberian flag (12.6%) and the Marshall Islands flag (11.9%). The shipping industry might be flexible when it comes to flags but, as it has been previously observed, there is a significant concentration as far as shipowners’ location and value of the fleet are concerned.
The same pattern can actually be spotted among shipping companies, in fact, as the world developed the industry began concentrating causing the emergence of shipping giants which operates, manages and controls a remarkable size of the business. One example is provided by the container ship segment:
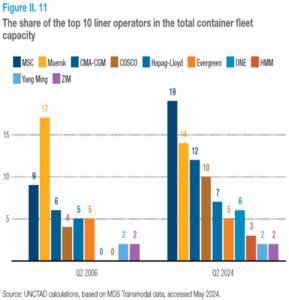
The chart provided by the UNCTAD already identified the top 10 market players back in 2006 and among them Maersk was the biggest liner operator with the Mediterranean Shipping Company (MSC) and CMA-CGM being the 2nd and the 3rd largest shipping operators in the liner business. Nevertheless, it is quite evident how the container segment concentrated over the years, in fact, the top 4 shipping liners (MSC, Maersk, CMA-CGM and COSCO) were managing, in the second quarter of 2024, the 55% of the container business.